Sine Along The Unit Circle
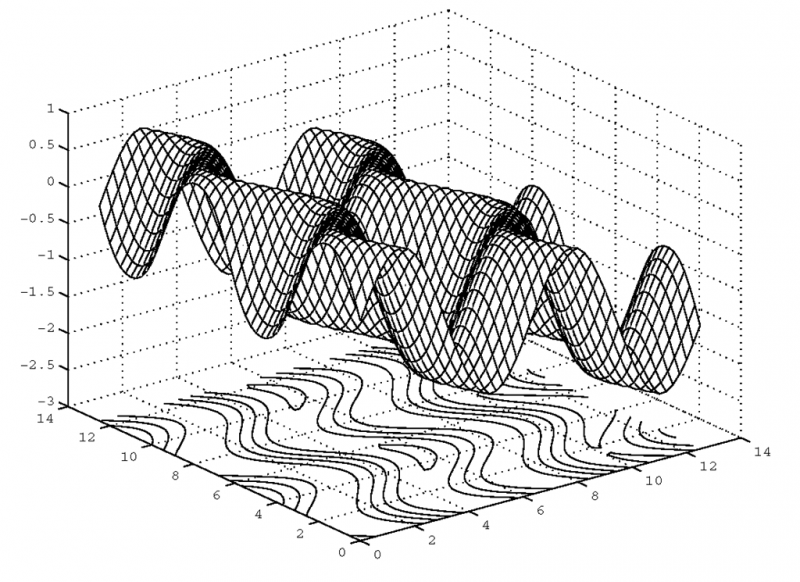
As an example, we can visualize the sine from 0 to 2π around a unit circle with the following code.
theta = 0:.2:2*pi;
x=sin(theta);
y=cos(theta);
z=sin(theta);
stem3(x,y,z);
hold on
plot3(x,y,z,’r’)
plot(x,y)
title(‘Sine Along the Unit Circle’)
zlabel(‘Sin(theta)’)
This code also plots the unit circle as well as a red line through the stems as shown in Figure 4.26.


(Source: Elementary 3-D Plotting (Plotting in Three Dimensions) (MATLAB) Part 4)